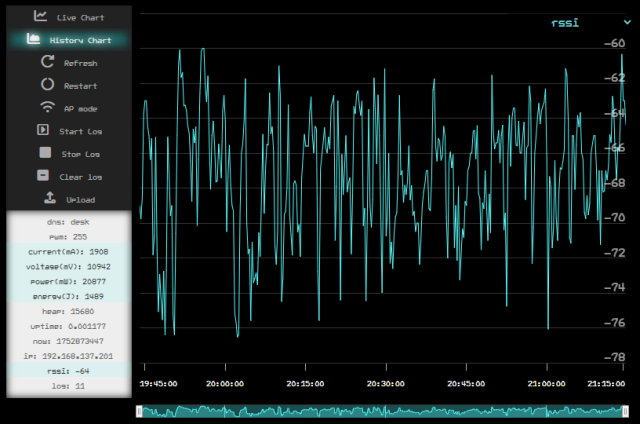
Highcharts 係最好用嘅 plot graph javascript library 有好多款式,但當去到過萬隻 record 時就會變得好慢,而且想 zoom in 某一小段時間再 pan 咁睇唔方便;經 copilot 介紹之後,我轉左有 range selector 嘅 HighCharts Stock 唔單只可以用 mouse wheel zoom 同 drag 咁 pan 夠晒方便,過萬隻 record 都明顯無問題,所以我覺得 plot graph 盡可能用針對 x-axis 造時間軸嘅 HighCharts Stock。由線型圖嘅 Highcharts 轉用 HighCharts Stock 主要由 highcharts.js 改為用 highstock.js,setup 只係有小小唔同。
我啲 data 主要來自 8266 配啲 sensor 例如電量計或者温濕度計, 用 ArduinoJson 每 40ms generate 一條 JSON,但大部份 data 只係 1 秒 update 一次,同時方便將每 1 秒嘅 JSON log 低變成 JSON Lines format,或者叫 jsonl,比 csv 更好用,亦有 converter 可以轉番造 csv。雖然 .jsonl 有普遍運用,但未係標準 file extension,MIME type 建議用 application/x-ndjson。
要 log data 之後方便睇返嘅話,最好就用 Arduino 係寫個 web page 放喺 8266 嘅 ESPAsyncWebServer,但因為 update flash 好麻煩,所以 html 中 body 空部係空白,只需要寫好唔會經常改嘅 head include 晒 jQuery 之類 library, 加上外掛 js 同 css 條 URL 放喺 local 嘅 Apache web server,寫嘅時候就同平時一樣只係不断改掛両個 file,用 js 加 element 入 body,再加 css style 即時睇倒效果點改變。
'use strict';
jQuery.noConflict();
/********************************************************************
setup
********************************************************************/
const mdns = window.location.hostname;
let ws = {};
const jsonURL = 'log.jsonl';
const excludeKeys = ['pwm', 'heap', 'uptime', 'now', 'log'];
let plotting_key = localStorage.getItem("plotting_key") || 'rssi';
let plotKeys = [];
let jsonl = [];
let jsonObj = {};
let highStock = {};
const htmlBody = `
<div id="container">
<div id="sidebar">
<input type="radio" name="chart" value="live" id="radio_chart_live" hidden checked><label for="radio_chart_live"><i class="fa-solid fa-chart-line"></i>Live Chart</label>
<input type="radio" name="chart" value="history" id="radio_chart_history" hidden><label for="radio_chart_history"><i class="fa-solid fa-chart-area"></i>History Chart</label>
<label id="btn_refresh"><i class="fa-solid fa-rotate-right"></i>Refresh</label>
<label id="btn_restart"><i class="fa-solid fa-circle-notch"></i>Restart</label>
<label id="btn_ap_mode"><i class="fa-solid fa-wifi"></i>AP mode</label>
<label id="btn_startlog"><i class="fa-solid fa-square-caret-right"></i>Start Log</label>
<label id="btn_stoplog"><i class="fa-solid fa-stop"></i>Stop Log</label>
<label id="btn_clearlog"><i class="fa-solid fa-square-minus"></i>Clear log</label>
<input id="upload" type="file" accept=".bin,.jsonl" name="filesystem"><label id="btn_upload" for="upload"><i class="fa-solid fa-upload"></i>Upload</label>
<div id="display-jsonl-data"></div>
<select id="menu-plotkey"></select>
</div>
<div id="chart"></div>
</div>
</div>`;
/********************************************************************
Highcharts setup
//https://www.highcharts.com/demo/stock/dynamic-update
********************************************************************/
Highcharts.setOptions({
chart: {
width: 640,
height: 540,
backgroundColor: '#000',
style: {
fontFamily: 'hoi1115e',
fontSize: '16',
},
},
title: { enabled: false },
plotOptions: {
series: {
states: {
hover: { enabled: false },
inactive: { opacity: 1 },
},
},
},
xAxis: {
type: 'datetime',
gridLineColor: '#333',
tickColor: '#AAA',
labels: {
style: {
color: '#FFF',
fontSize: '1em',
}, formatter: function () {
return Highcharts.dateFormat('%H:%M:%S', this.value);
},
},
},
yAxis: {
gridLineColor: '#333',
labels: {
style: {
color: '#FFF',
fontSize: '1.5em',
opacity: 0.6,
},
},
},
lang: {
thousandsSep: '',
decimalPoint: '.',
},
scrollbar: { enabled: false },
credits: { enabled: false },
rangeSelector: { enabled: false },
accessibility: { enabled: false },
});
/********************************************************************
document ready
********************************************************************/
jQuery(function () {
jQuery("body").append(htmlBody);
fn_ws_mdns_json(mdns, "#display-jsonl-data");
//button
jQuery('#menu-plotkey').on('change', function () {
const type = jQuery(this).val();
localStorage.setItem('plotting_key', type);
plotting_key = type;
if (jQuery('input[name="chart"]:checked').val() == 'live') {
highStock.series[0].setData([]); // clear data
} else if (jQuery('input[name="chart"]:checked').val() == 'history') {
fn_highstock_changekey(type);
}
});
jQuery('input[name="chart"]').on('change', function () { //live || history
if (jQuery('input[name="chart"]:checked').val() == 'live') {
fn_highstock_live();
} else if (jQuery('input[name="chart"]:checked').val() == 'history') {
fn_fetch_json(jsonURL);
}
});
jQuery('#btn_refresh').on('click', function () {
location.reload();
});
jQuery('#btn_restart').on('click', function () {
fn_ws_send({ WSRX: 'RESTART' });
});
jQuery('#btn_startlog').on('click', function () {
fn_ws_send({ WSRX: 'STARTLOG' });
});
jQuery('#btn_stoplog').on('click', function () {
fn_ws_send({ WSRX: 'STOPLOG' });
});
jQuery('#btn_clearlog').on('click', function () {
fn_ws_send({ WSRX: 'CLEARLOG' });
});
jQuery('#upload').on('change', function (e) {
const file = e.target.files[0];
if (!file) return;
const ext = file.name.split('.').pop().toLowerCase();
if (ext == 'jsonl') {
fn_read_jsonl(file);
} else if (ext == 'bin') { // esp littlefs flash update
const formData = new FormData();
formData.append('file', file);
fetch('/update', {
method: 'POST',
body: formData
});
}
});
jQuery('#display-jsonl-data').on('click', 'li.plotkey', function () {
const type = jQuery(this).data('type');
console.log(type); //no effect when live but not when static?
});
setInterval(loop_40ms, 40);
setInterval(loop_1000ms, 1000);
}); // end of document ready
/********************************************************************
loop
********************************************************************/
function loop_40ms() {
if (jQuery('#radio_chart_live').is(':checked')) {
if (ws.readyState == 1) {
fn_list_json(jsonObj);
}
}
}
function loop_1000ms() {
if (jQuery('#radio_chart_live').is(':checked')) {
if (ws.readyState == 1) {
const x = jsonObj["now"] * 1000;
const y = jsonObj[plotting_key];
highStock.series[0].addPoint([x, y], true, false); //display all live data
} else {
fn_ws_mdns_json(mdns); // Reconnect after 1 second
}
}
}
/********************************************************************
functions
********************************************************************/
function fn_ws_mdns_json(mdns) {
ws = new WebSocket('ws://' + mdns + '/ws');
ws.onopen = function () {
console.log('WebSocket connected');
fn_highstock_live();
};
ws.onmessage = function (event) {
const msg = event.data;
if (typeof msg == 'string' && msg.trim().startsWith('{') && msg.trim().endsWith('}')) {
try {
jsonObj = JSON.parse(msg);
} catch (err) {
console.warn("Invalid JSON:", msg);
}
} else {
console.log("WebSocket message:", msg);
}
};
ws.onclose = function () {
console.log('WebSocket closed');
};
ws.onerror = function (error) {
console.log('WebSocket error: ' + error);
};
}
function fn_list_json(json) {
if (!json) return;
jsonObj = json; //global jsonObj
const items = Object.entries(json).map(([key, val]) => {
return `<li data-type='${key}' data-val='${val}'>${key}: ${val}</li>`;
});
jQuery('#display-jsonl-data').html(`<ul>${items.join('')}</ul>`);
jQuery('#display-jsonl-data ul li').each(function () {
const type = jQuery(this).data('type');
const keys = Object.keys(json);
plotKeys = keys.filter((k) => typeof json[k] == 'number' && !excludeKeys.includes(k));
if (plotKeys.includes(type)) {
jQuery(this).addClass('plotkey');
}
});
jQuery('#menu-plotkey').empty();
plotKeys.forEach((key) => {
jQuery('#menu-plotkey').append(`<option value="${key}">${key}</option>`);
});
jQuery('#menu-plotkey').val(plotting_key);
}
function fn_highstock_live() {
highStock = Highcharts.stockChart('chart', {
series: [{
data: [],
color: 'cyan',
lineWidth: 1
}],
tooltip: {
enabled: false,
shared: false,
split: false,
crosshairs: false
},
navigator: { enabled: false },
});
}
function fn_fetch_json(jsonURL) {
jQuery.get(jsonURL, function (text) {
try {
const obj = JSON.parse(text);
jsonObj = obj;
jsonl = [obj];
} catch (err) {
const lines = text.split('\n');
lines.forEach(function (line) {
if (line.trim() !== '') {
try {
const obj = JSON.parse(line);
jsonl.push(obj);
} catch (e) {
console.log('Parse error:', e);
}
}
});
jsonObj = jsonl.at(-1);
}
fn_list_json(jsonObj);
fn_highstock_jsonl(jsonl);
}); //end of fetch
}
function fn_read_jsonl(file) {
const reader = new FileReader();
reader.onload = function (evt) {
const text = evt.target.result;
const lines = text.split('\n');
jsonl = [];
lines.forEach(line => {
if (line.trim()) {
try {
const obj = JSON.parse(line);
jsonl.push(obj);
} catch (e) {
console.warn('JSON parse error:', e);
}
}
});
jsonObj = jsonl.at(-1);
fn_list_json(jsonObj);
fn_highstock_jsonl(jsonl);
};
reader.readAsText(file);
}
function fn_highstock_jsonl(jsonl, key) {
if (key == null) key = plotting_key;
plotting_key = key; // Update global plotting key
if (jsonl.length > 0) {
const data1 = jsonl.map((obj) => {
if (typeof obj[key] == 'number' && typeof obj.now == 'number') {
return [obj.now * 1000, obj[key]];
} return null;
}).filter(Boolean);
highStock = Highcharts.stockChart('chart', {
navigator: {
height: 16,
series: {
fillOpacity: 0.3,
lineWidth: 1,
},
xAxis: {
gridLineColor: '#999',
labels: {
enabled: false,
},
},
outlineColor: '#333',
maskFill: 'rgba(0, 255, 255, 0.3)',
},
tooltip: {
shared: true,
formatter: function () {
jsonObj = jsonl.find((obj) => obj.now == this.x / 1000); //global jsonObj
fn_list_json(jsonObj);
return false;
},
},
series: [{
name: key,
data: data1,
color: 'cyan',
lineWidth: 1
}]
});
}
}
function fn_highstock_changekey(key) {
const xMin = highStock.xAxis[0].min;
const xMax = highStock.xAxis[0].max;
const newData = jsonl.map(obj => {
if (typeof obj[key] == 'number' && typeof obj.now == 'number') {
return [obj.now * 1000, obj[key]];
}
return null;
}).filter(Boolean);
highStock.series[0].update({
name: key,
data: newData
}, false); // false to prevent redrawing
highStock.xAxis[0].setExtremes(xMin, xMax);
highStock.redraw();
plotting_key = key; // Update global plotting key
}
function fn_ajax_post(URL) {
jQuery.ajax({
url: URL,
type: 'POST',
});
}
function fn_ws_send(data) {
if (ws.readyState == 1) {
ws.send(JSON.stringify(data));
console.log('WebSocket: ' + JSON.stringify(data));
}
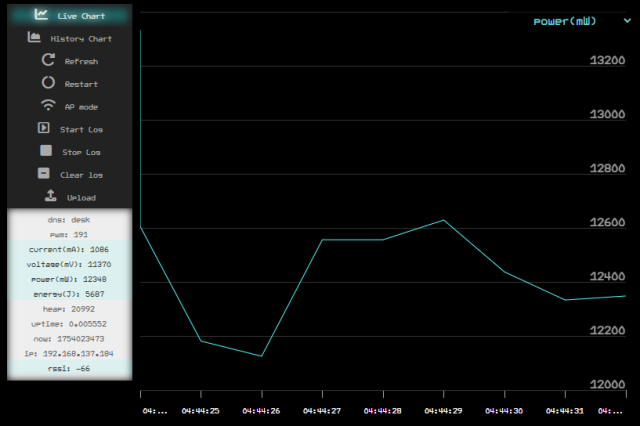
}個 UI 有制需要同 8266 双向溝通,我用左 websocket 可以去到 poll rate 25Hz update 啲 data,可以加埋每 1秒 update 嘅 live chart。websocket server 用 Arduino 寫,websocket client 即係 broswer 用 javascript,但概念係一樣都係 setup 先閑一次之後再閑 40ms 同 1000ms 両個 loop。
我認為造設計唔可能只限識畫圖而唔識寫曲,唔了解有乜 library 可以用同造倒啲乜或者有乜特質嘅話根本唔會造得好,分工只適合以 frontend 同 backend 去分,frontend 或者 wordpress theme 啲曲唔會太難。以我寫曲嘅程度需要逐句問 copliot 咁慢慢寫,取代睇 API reference 或者 example 學用 library 坑番大量時間,尤其是用 Edge 內置嘅 copliot 有權根了解 broswer 內容解決大要溝通問題,特別寫 web 嘅 frontend 相當受惠,;同樣道理, vscode 嘅話就裝 github copliot 比佢了解寫梗段曲嘅內容。但 copliot 啲曲唔係最簡單最容易理解,對於唔係專業寫曲嘅人,我覺得最梗要寫到方便自己將來睇番都睇得明,靠 broswer 或者 compiler 驗證自己啲諗法有無問題,䀆量整理好啲簡單啲方便重復運用。
Live demo:
Reference: